Basic data operations in ManiVault Studio
- ManiVault Studio 1.2 or higher
- |
- 22 Nov 2024
- |
- Thomas
- |
- 6 min read
To start working with data in ManiVault Studio, the data first needs to be imported. ManiVault Studio leverages its flexible plugin architecture to support loading data in various formats. Currently, the following formats are supported:
- CSV (Comma-Separated Values)
- Image files
- H510X
- H5AD (Hierarchical Data Format for annotated data)
- TOME
- Binary files
When data is loaded into ManiVault Studio, plugins are utilized to perform various tasks, including:
- View the data
Display and explore the loaded data in an interactive environment. - Edit data and analysis properties
Modify dataset properties and adjust analysis parameters as needed. - Transform the data
Apply operations to reshape, normalize, or preprocess the data for analysis. - Analyze the data
Use built-in or custom algorithms to extract insights and generate results. - Export the data
Save processed data and results in supported formats for further use or sharing.
Import data
There are three primary methods to import data:
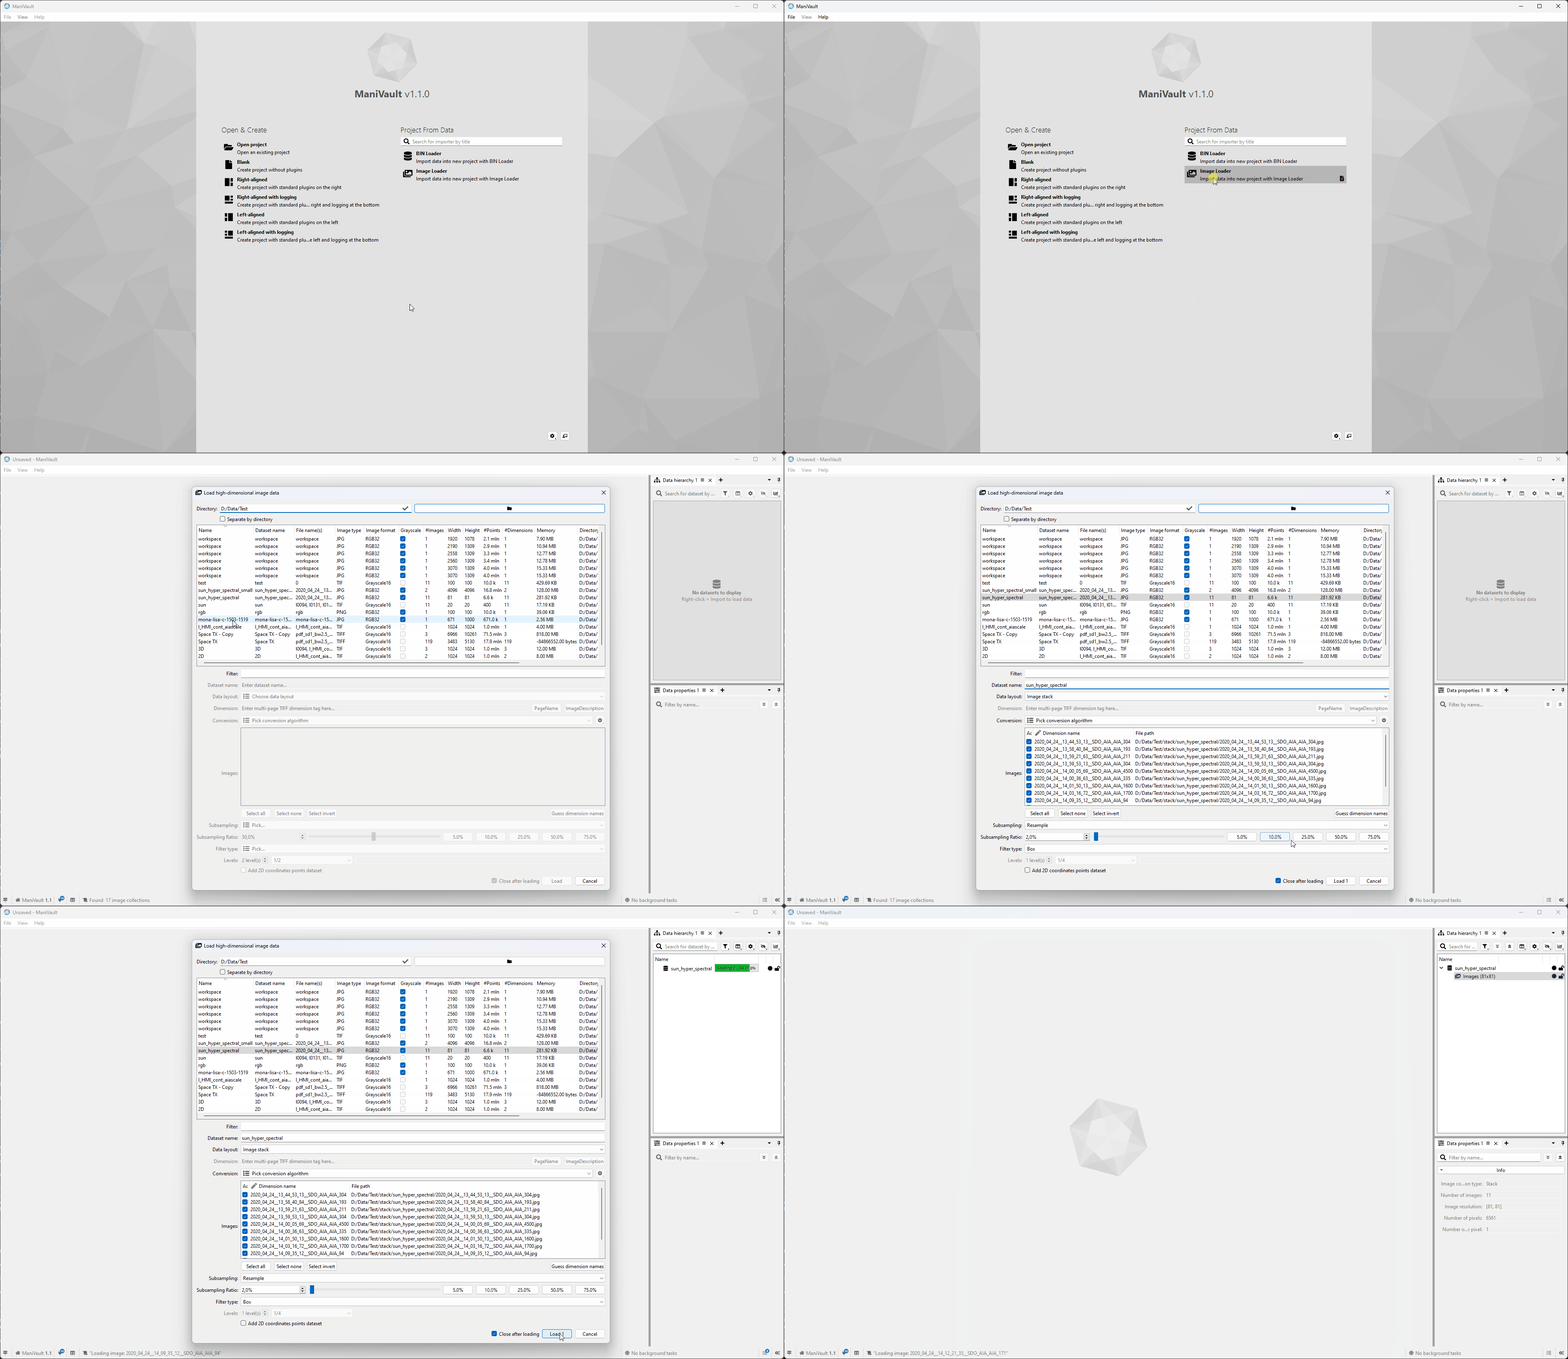
From the start page
Click to view the video
From the main menu
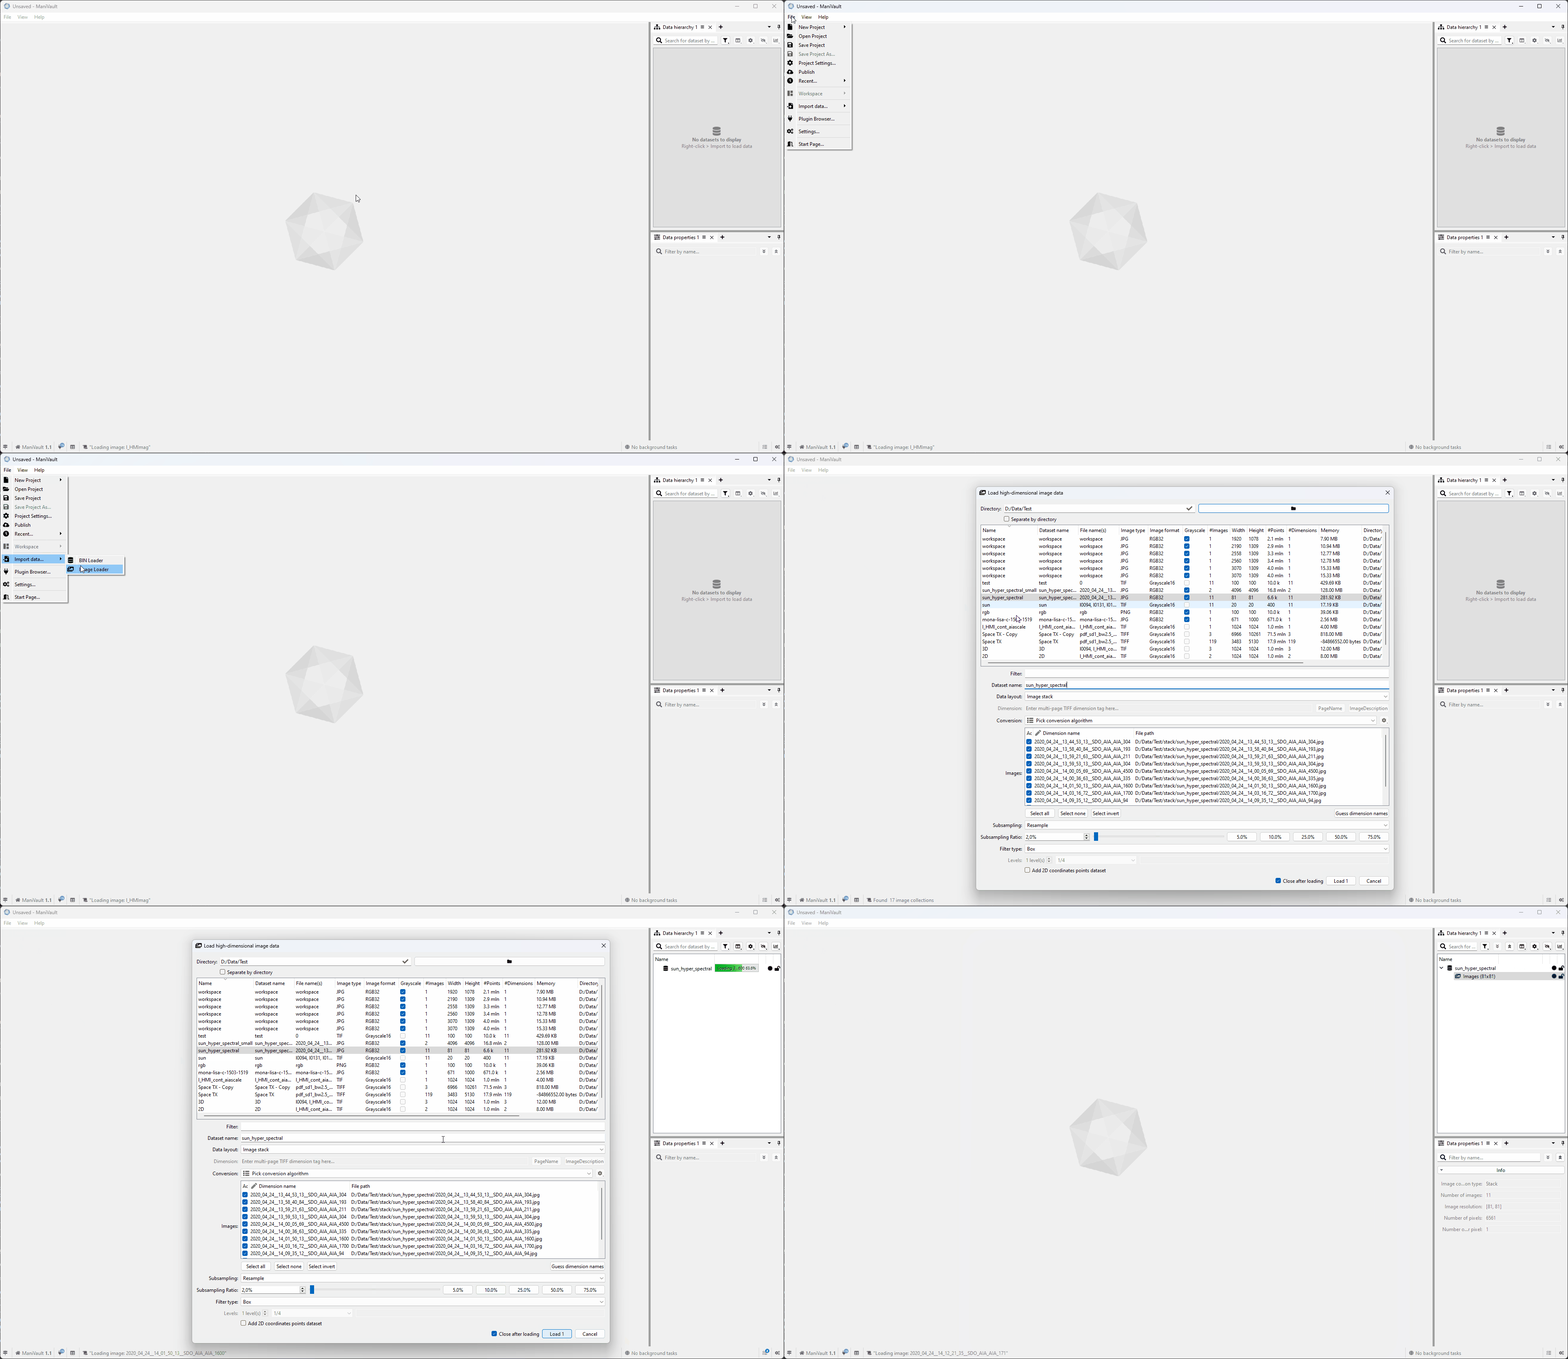
To import data from the main menu:
- Go to Main menu
- File > Import data > Loader plugin
Click to view the video
From the data hierarchy plugin
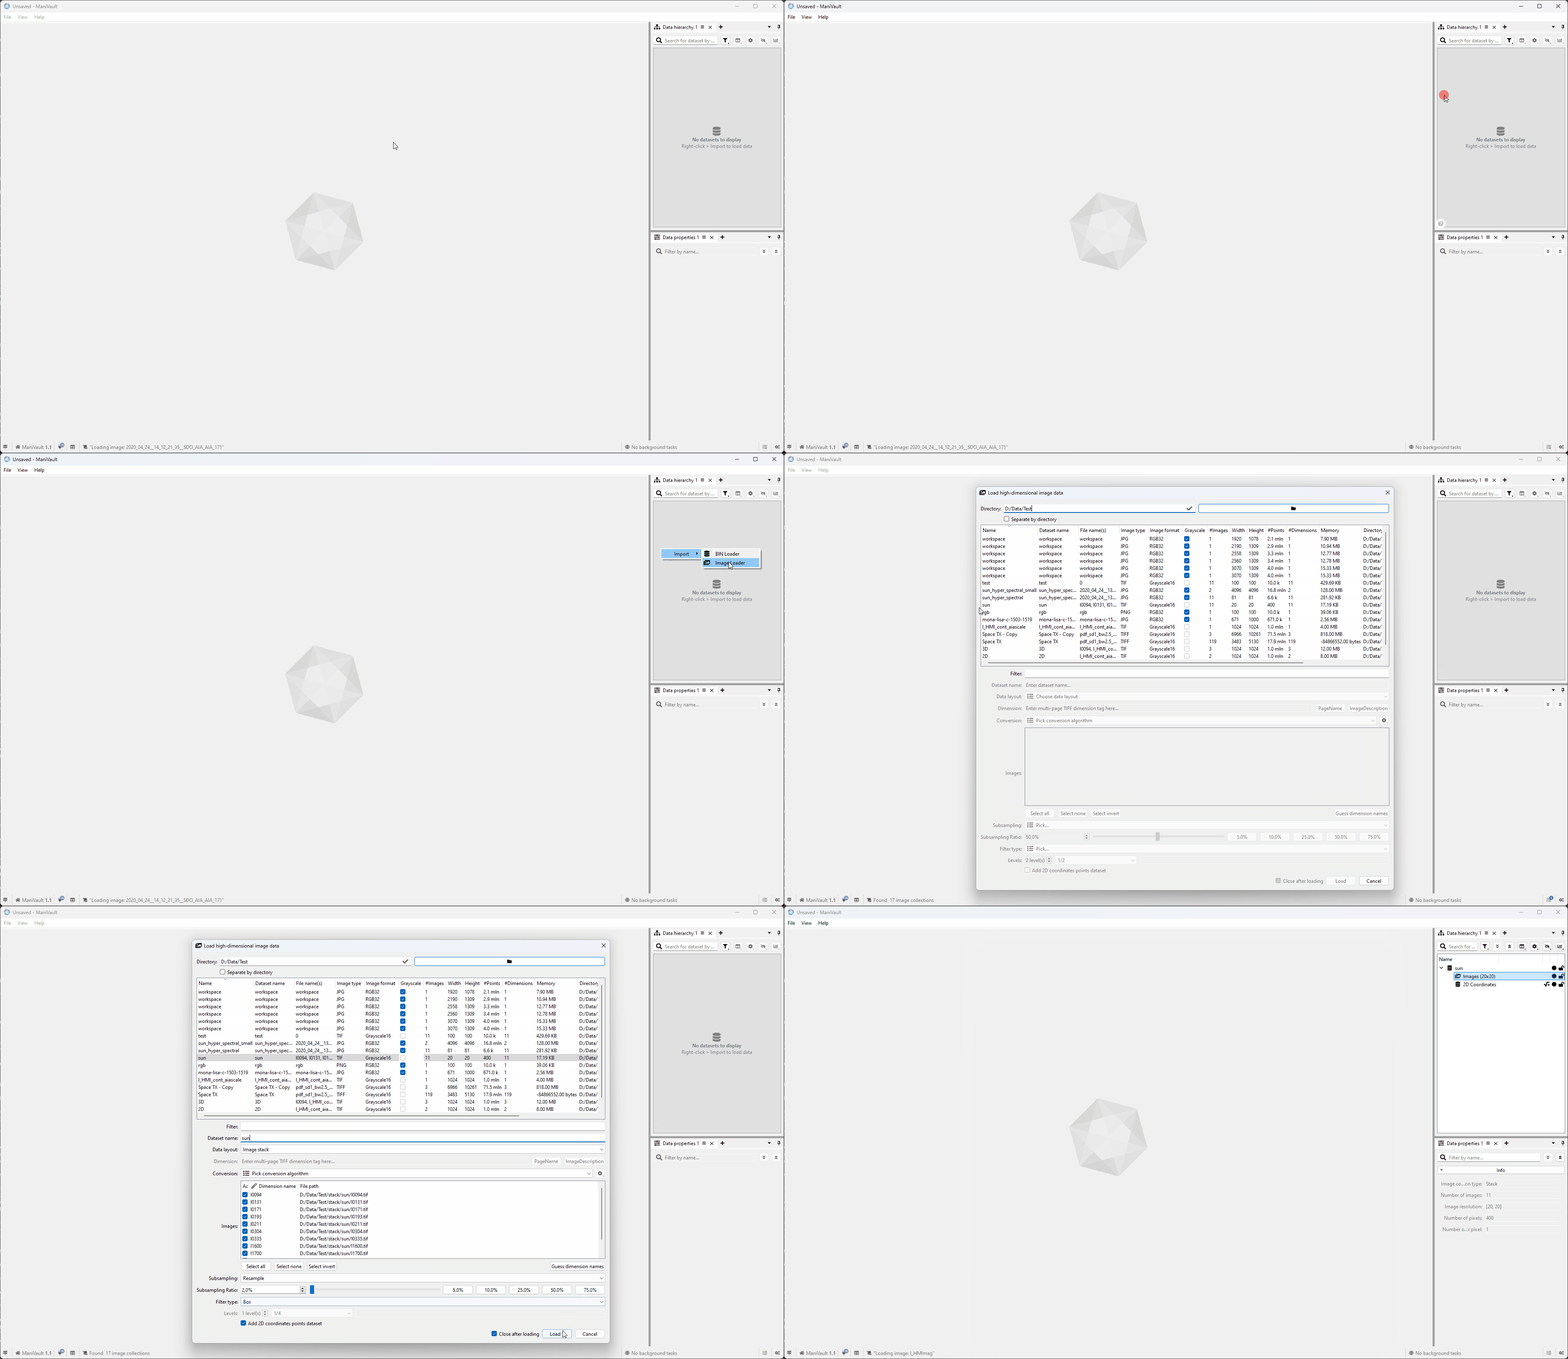
To import data into ManiVault using the data hierarchy plugin:
- Right-click in an empty area of the data hierarchy to show the context menu
- Click on Import, this will show all data import plugins (this menu is not available when there are no compatible importer plugins)
- Click to start the importer of choice
Click to view the video
View data
ManiVault Studio leverages its flexible and extendible plugin architecture to offer various viewing modalities. With these modalities, an advanced visual analytics application can be built. A few examples of the view plugins that are shipped with ManiVault Studio:
- Scatterplot
High-performance scatterplot, capable of handling millions of data points. - Image viewer
Viewer plugin for working with high-dimensional images - Dimensions viewer
Viewer for inspecting high dimensional data dimensions
To view data, follow these steps:
- Create the data view
There are three ways to create a new data view. - Load data in the view
The data hierarchy plugin plays a pivotal role in viewing data. Use this plugin to load data in the view.
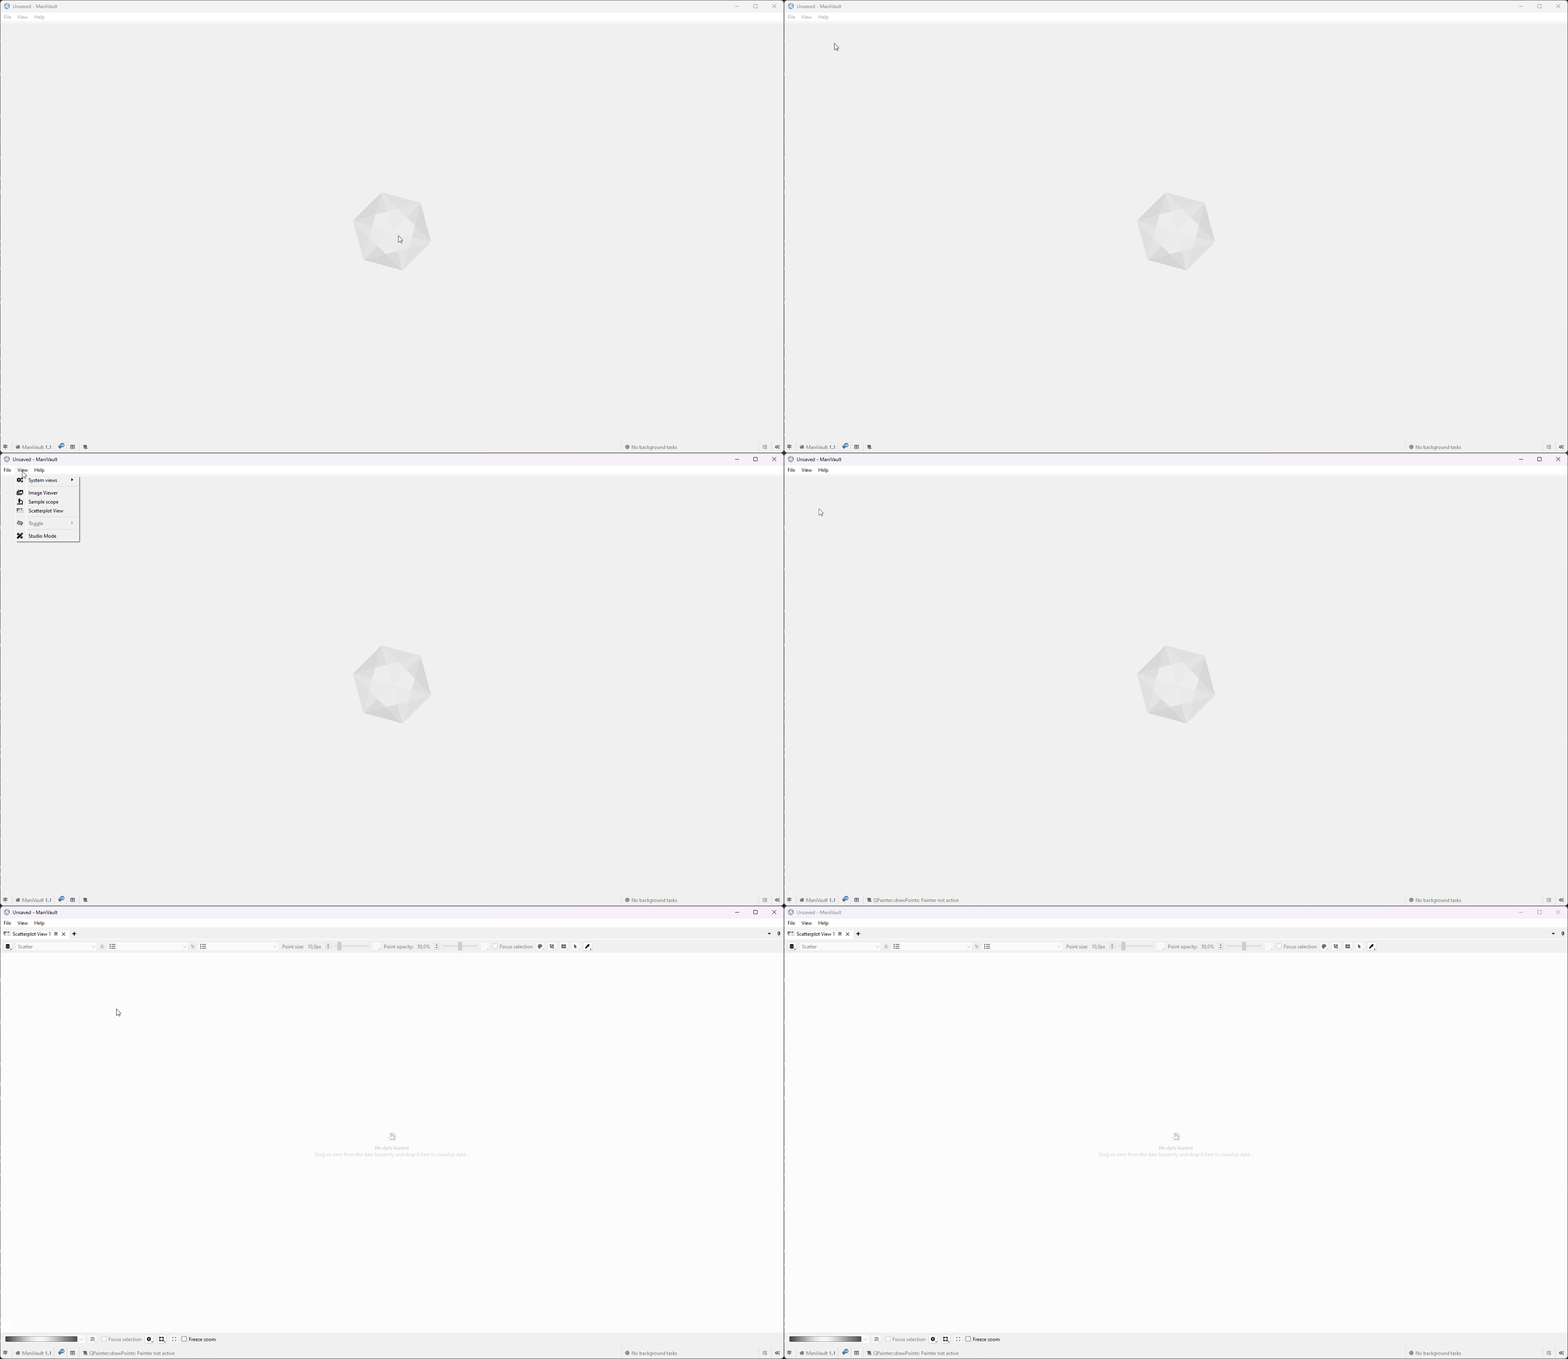
Create the data view
From the main menu:
- Go to Main menu
- View > View plugin of choice
Click to view the video
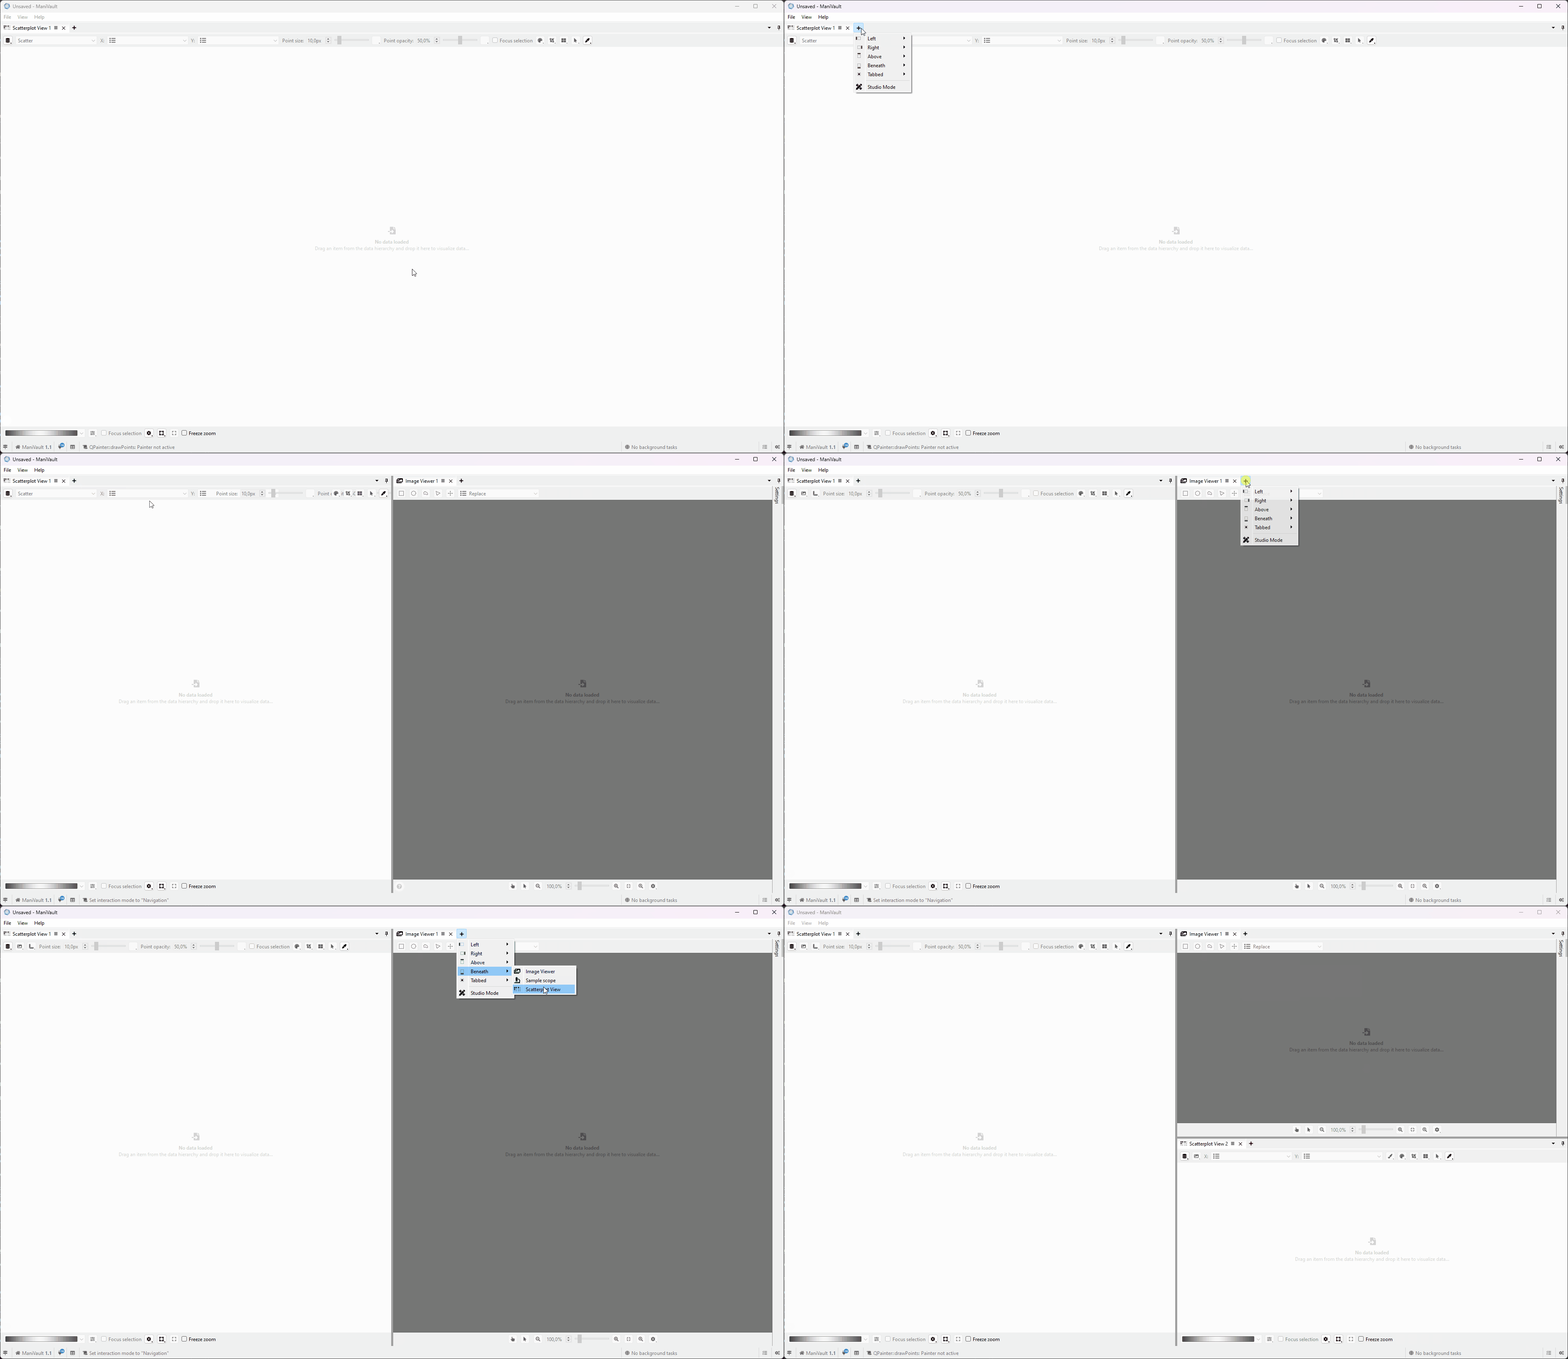
Relative to an existing view:
A view plugin can also be created and positioned relative to an existing view:
- Click the plus sign next to an existing view plugin
- Choose where to place the new view (Left, Right, Above, Beneath or Tabbed)
- Select View plugin of choice
Click to view the video
From the data hierarchy plugin:
A view plugin can also be created directly from the data hierarchy plugin. Below is an example. For detailed instructions, see the section below.
Click to view the video
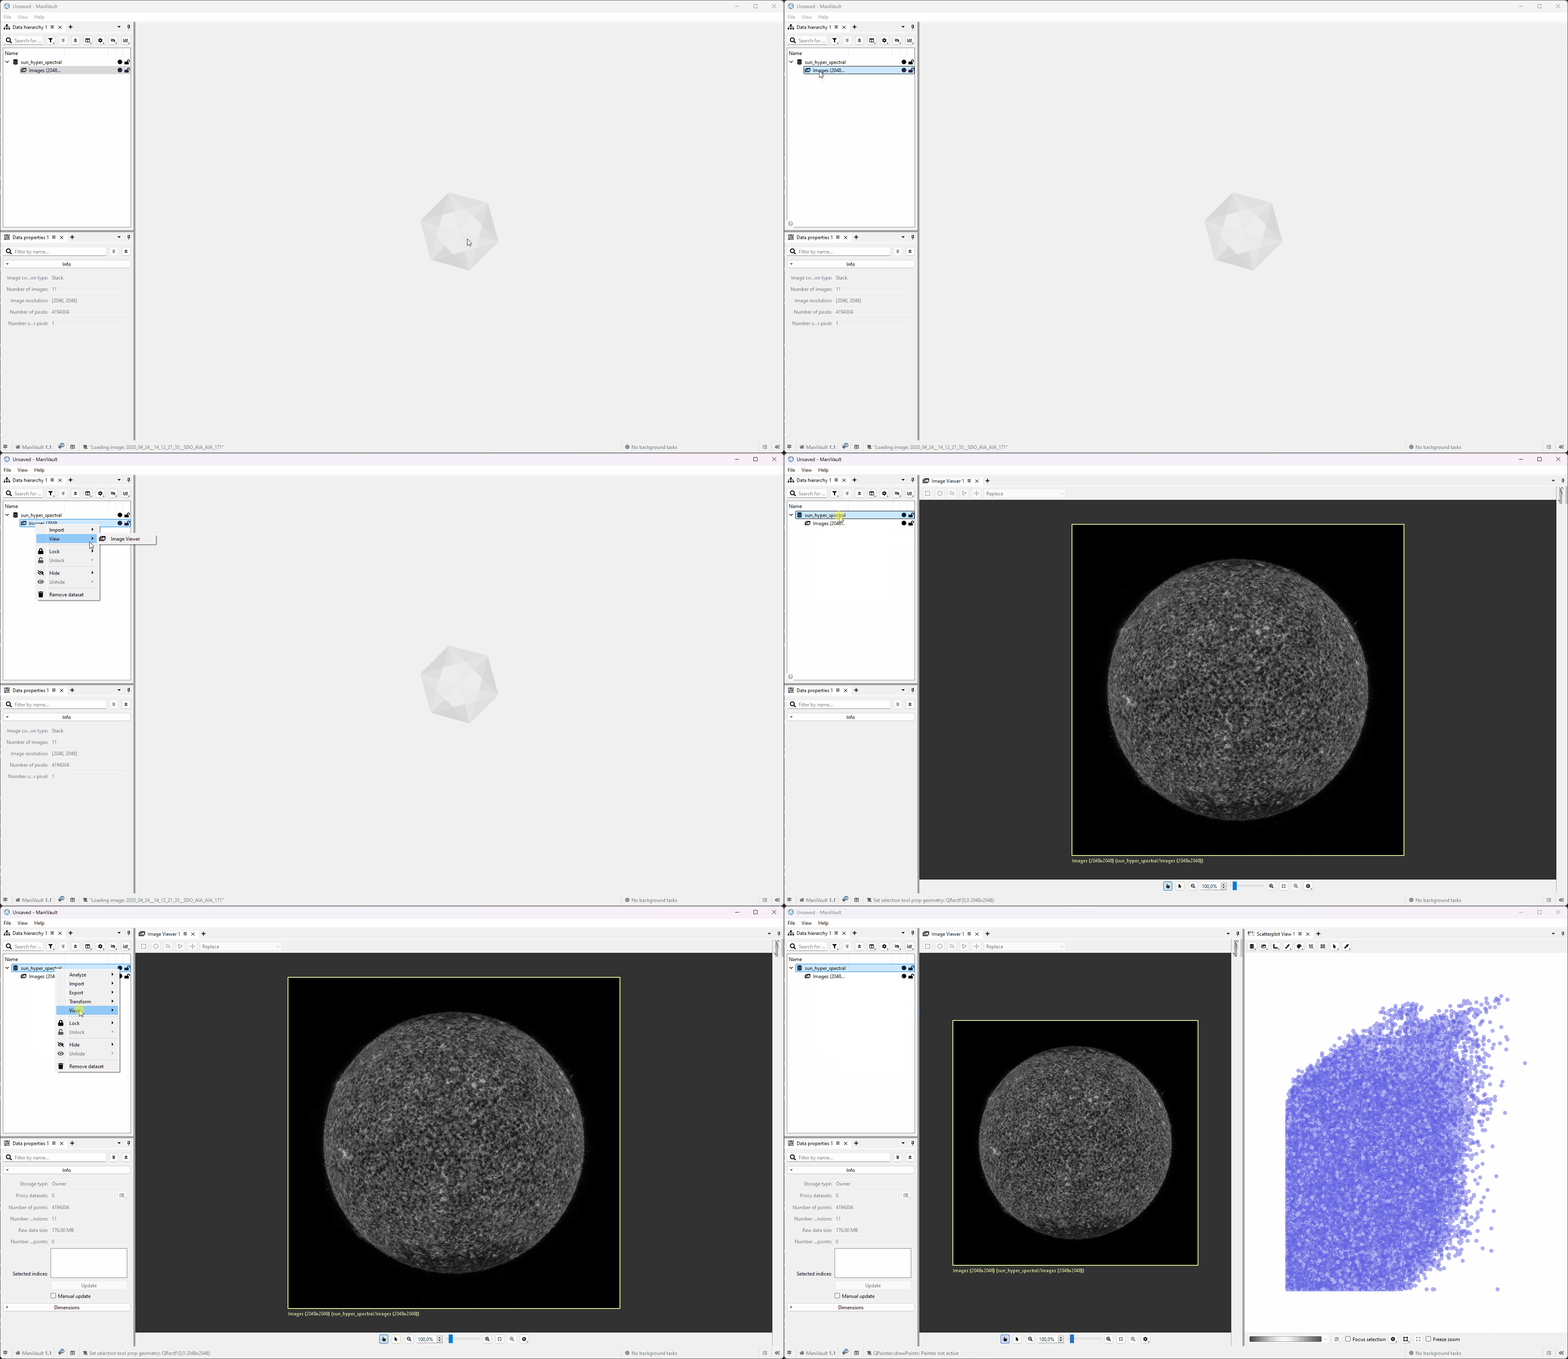
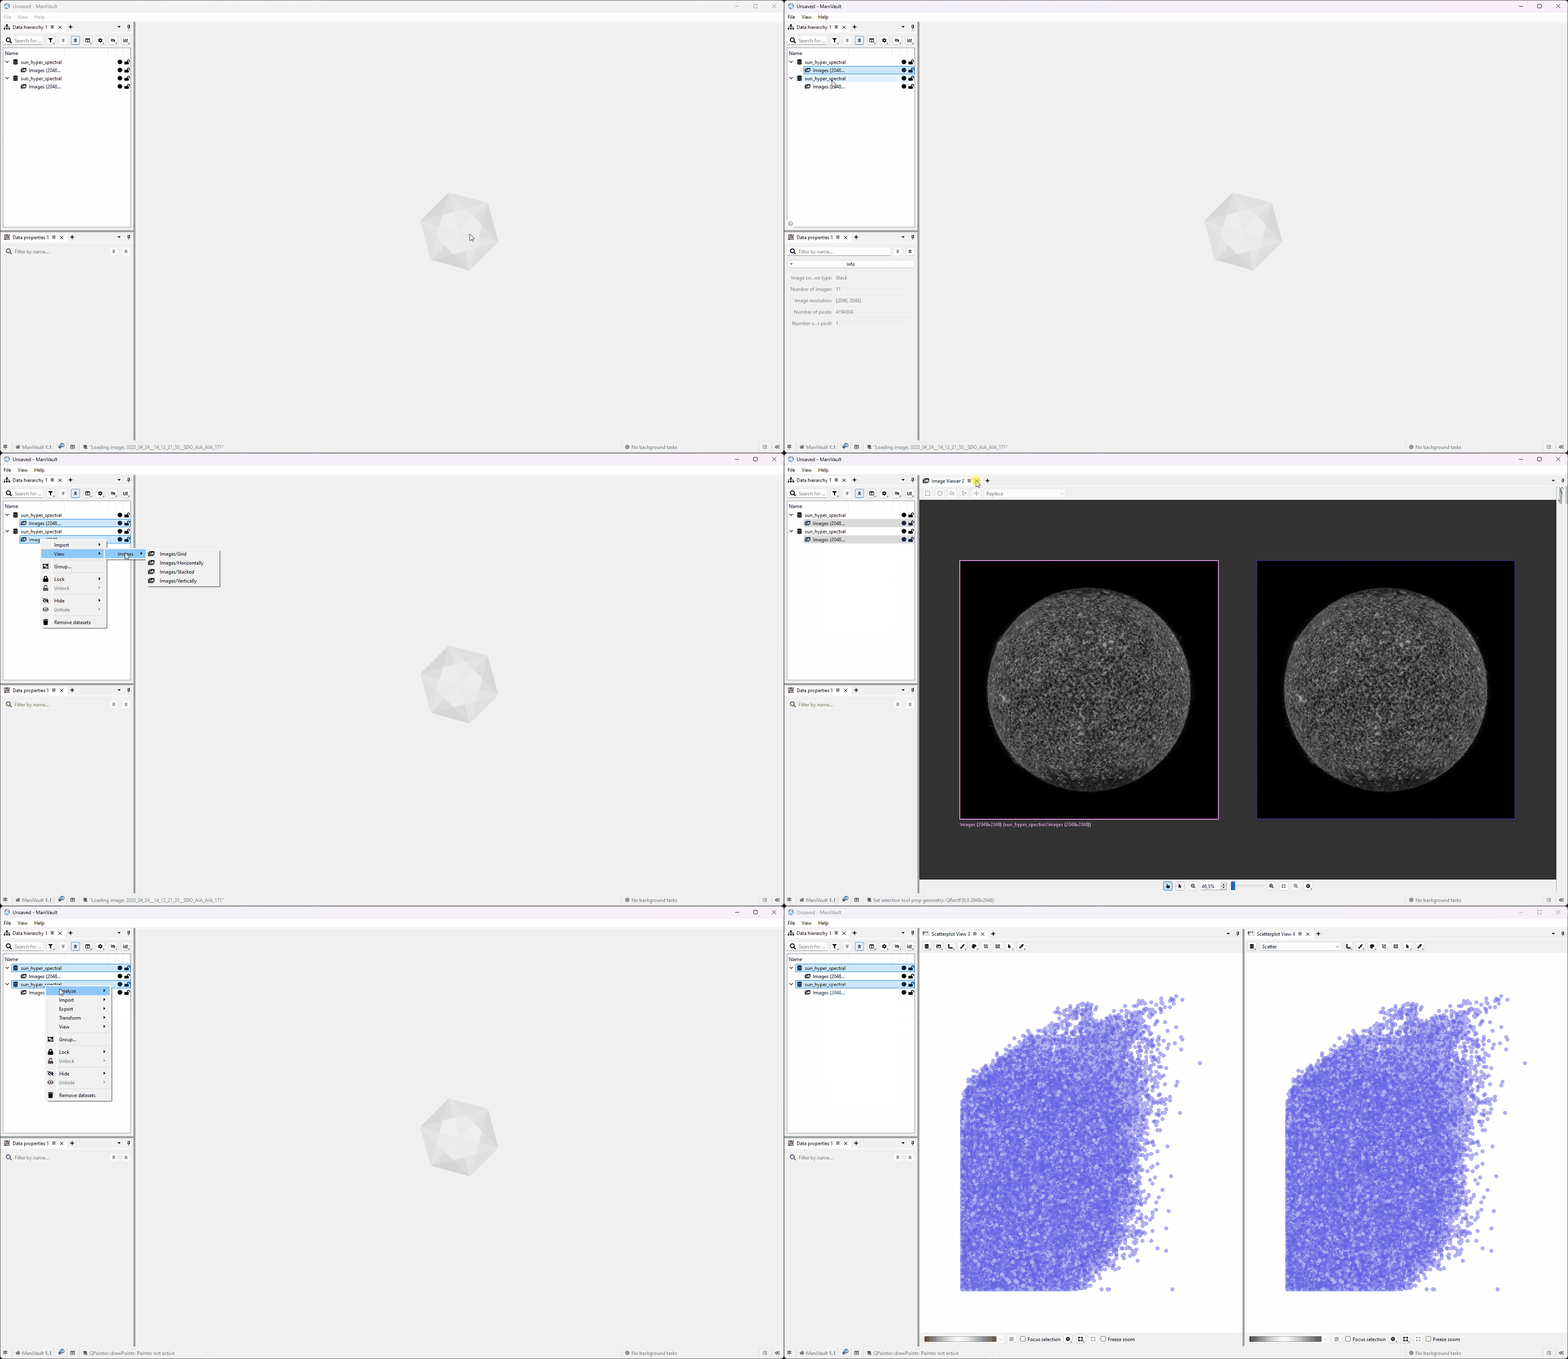
View a single dataset:
- Select a single dataset
- Right-click to show the context menu
- Click on View, this will show all compatible view plugins (this menu is not available when there are no compatible view plugins)
- Click the view plugin of choice
Click to view the video
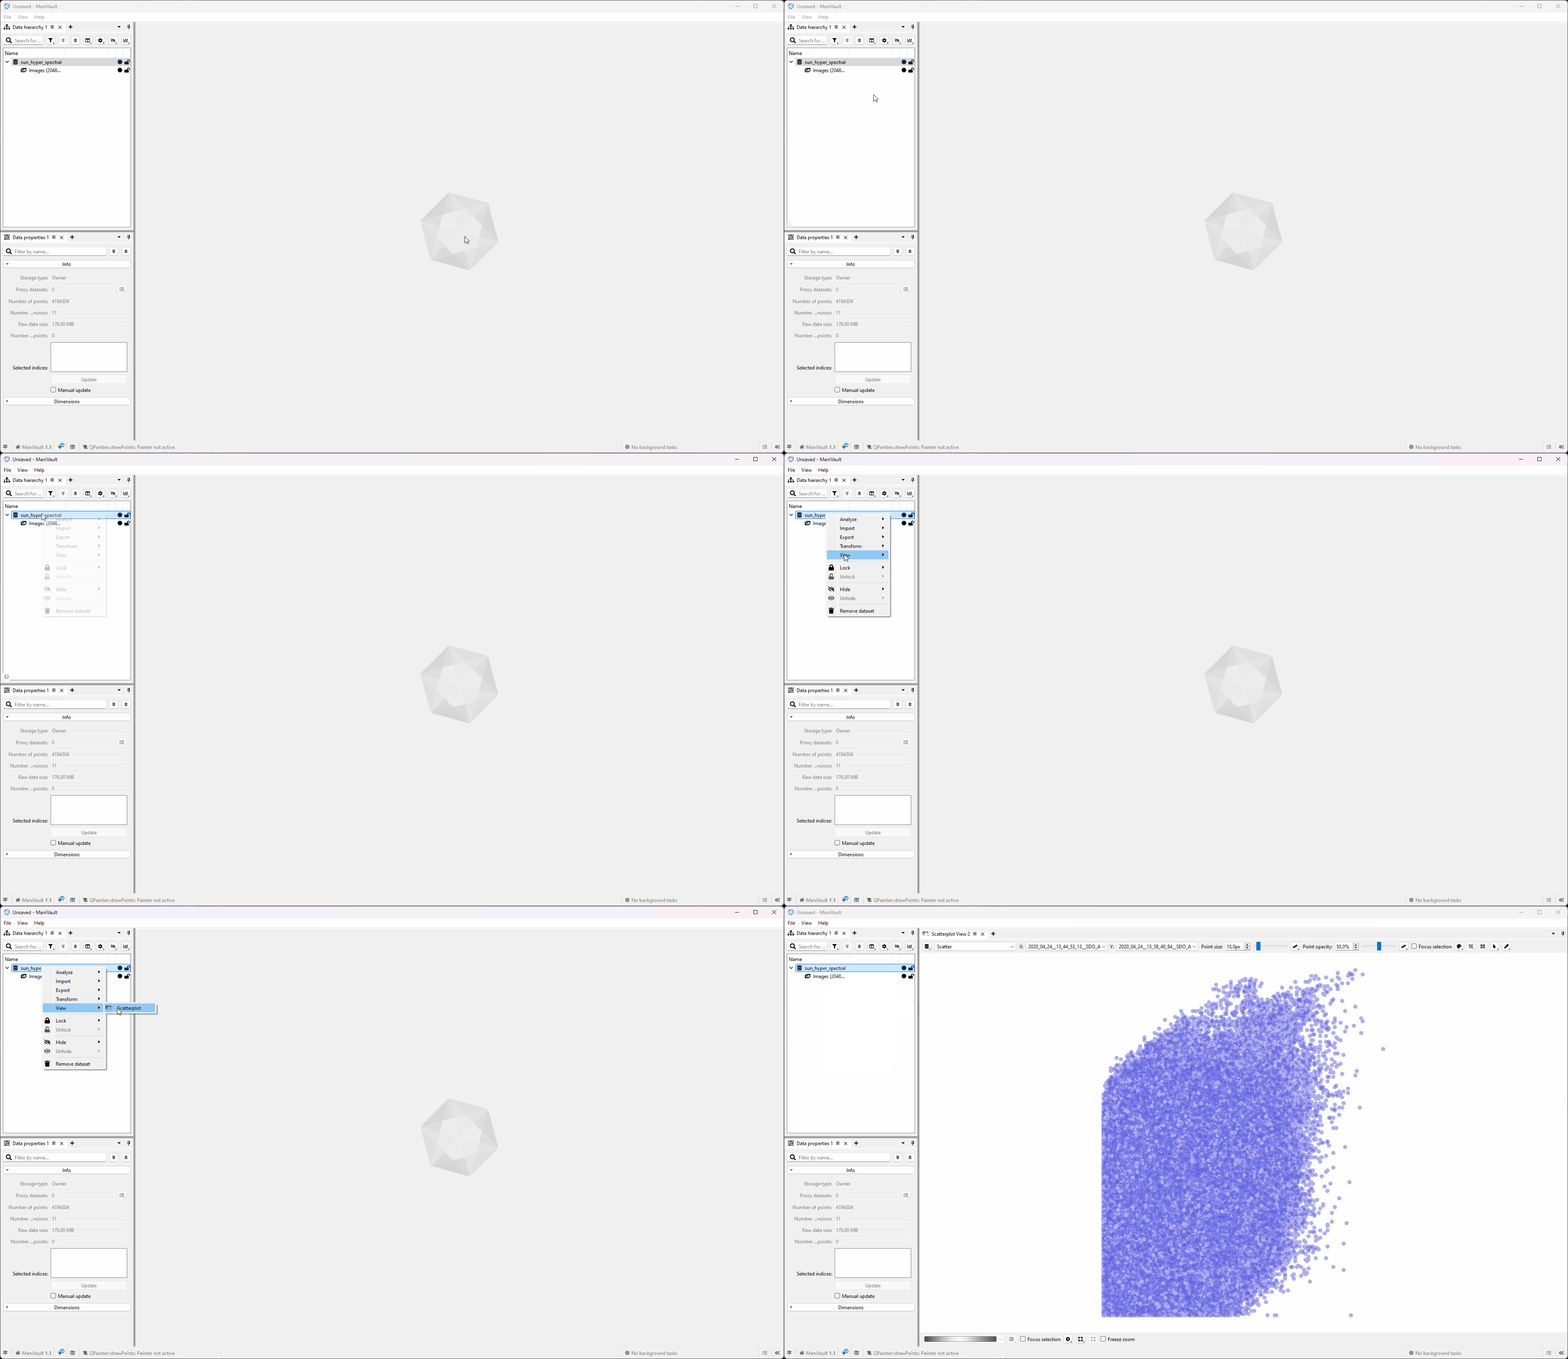
View multiple datasets:
- Select multiple datasets (hold CTRL to add a dataset and SHIFT to select a range of datasets)
- Right-click to show the context menu
- Click on View, this will show all compatible view plugins (this menu is not available when there are no compatible view plugins)
- Click the view plugin of choice
Click to view the video
View dataset(s) with drag and drop:
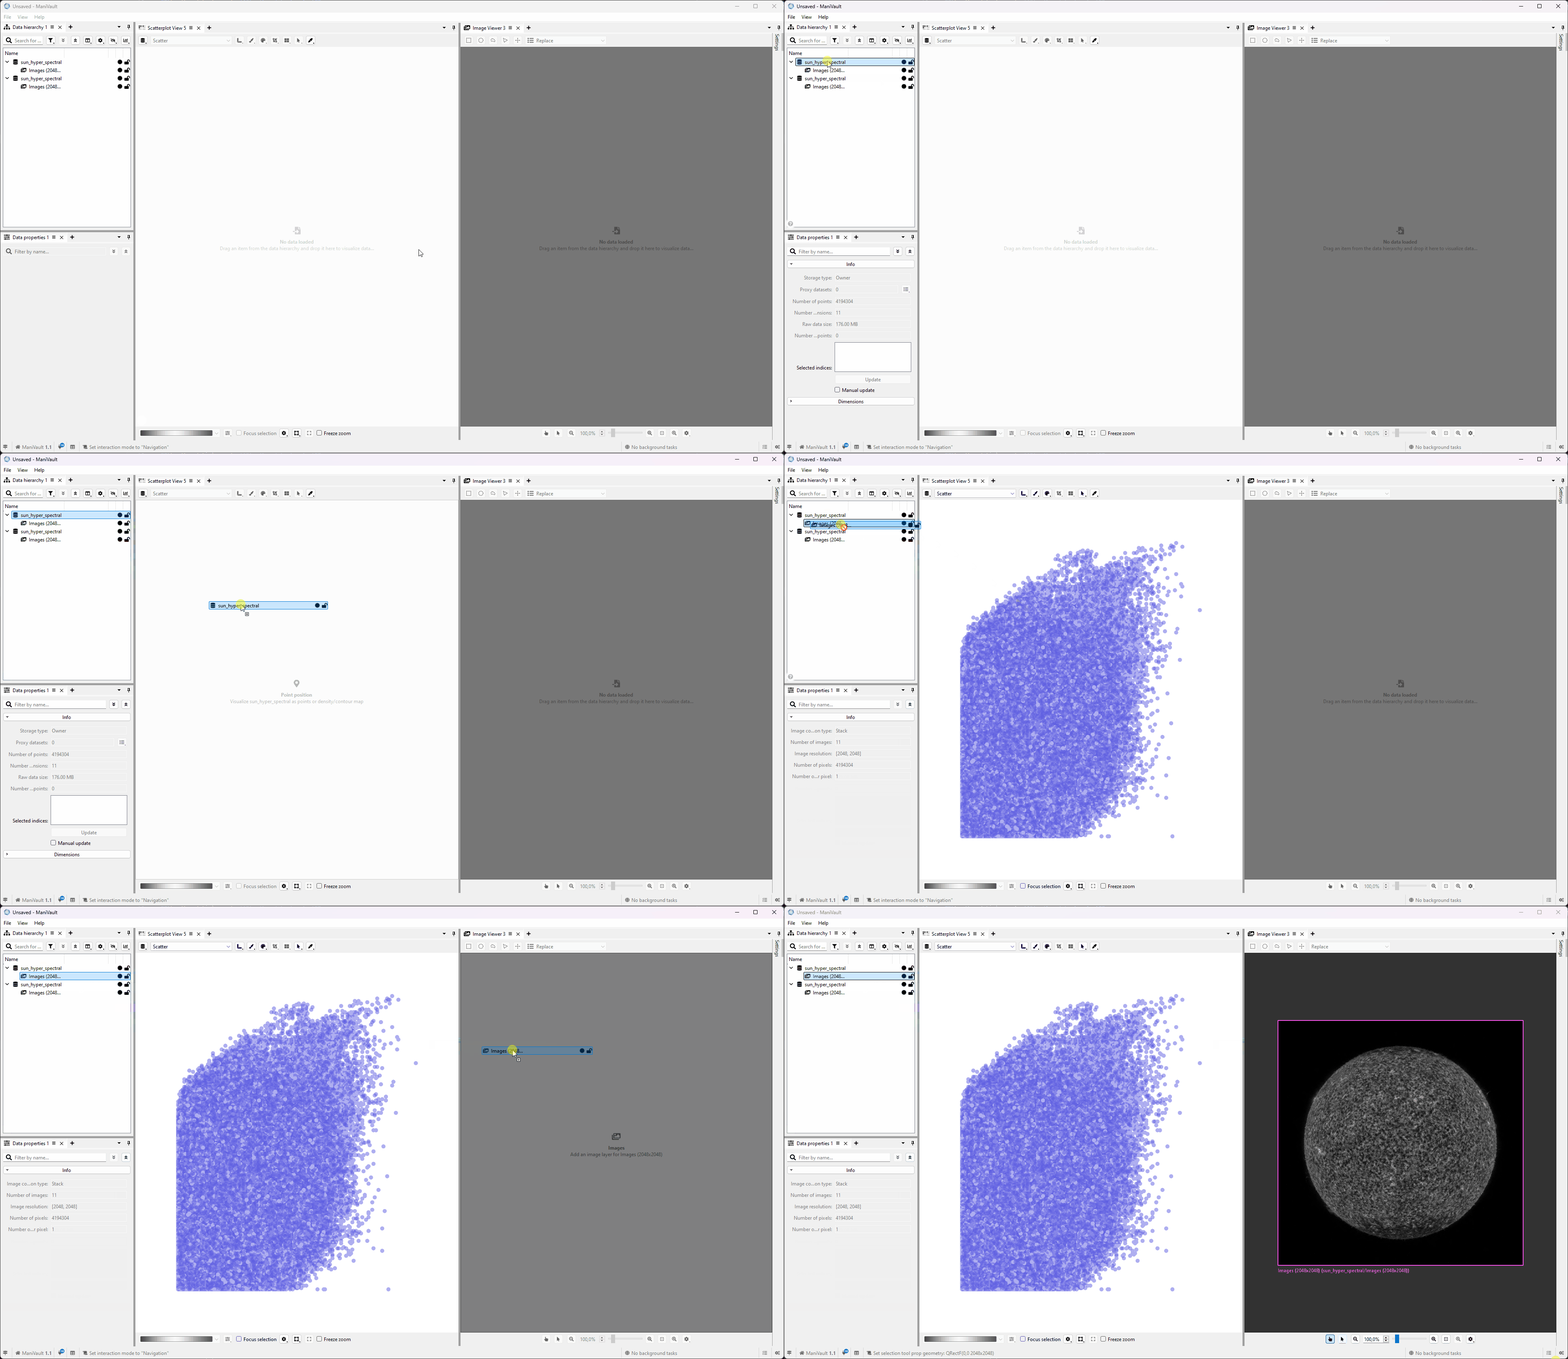
The data hierarchy plugin supports drag-and-drop behavior which makes it trivial to load data in a view:
- Select dataset(s)
- Hold LMB down and move to view plugin in which you want to show the data
- Drop the data by releasing the LMB
Click to view the video
Edit data
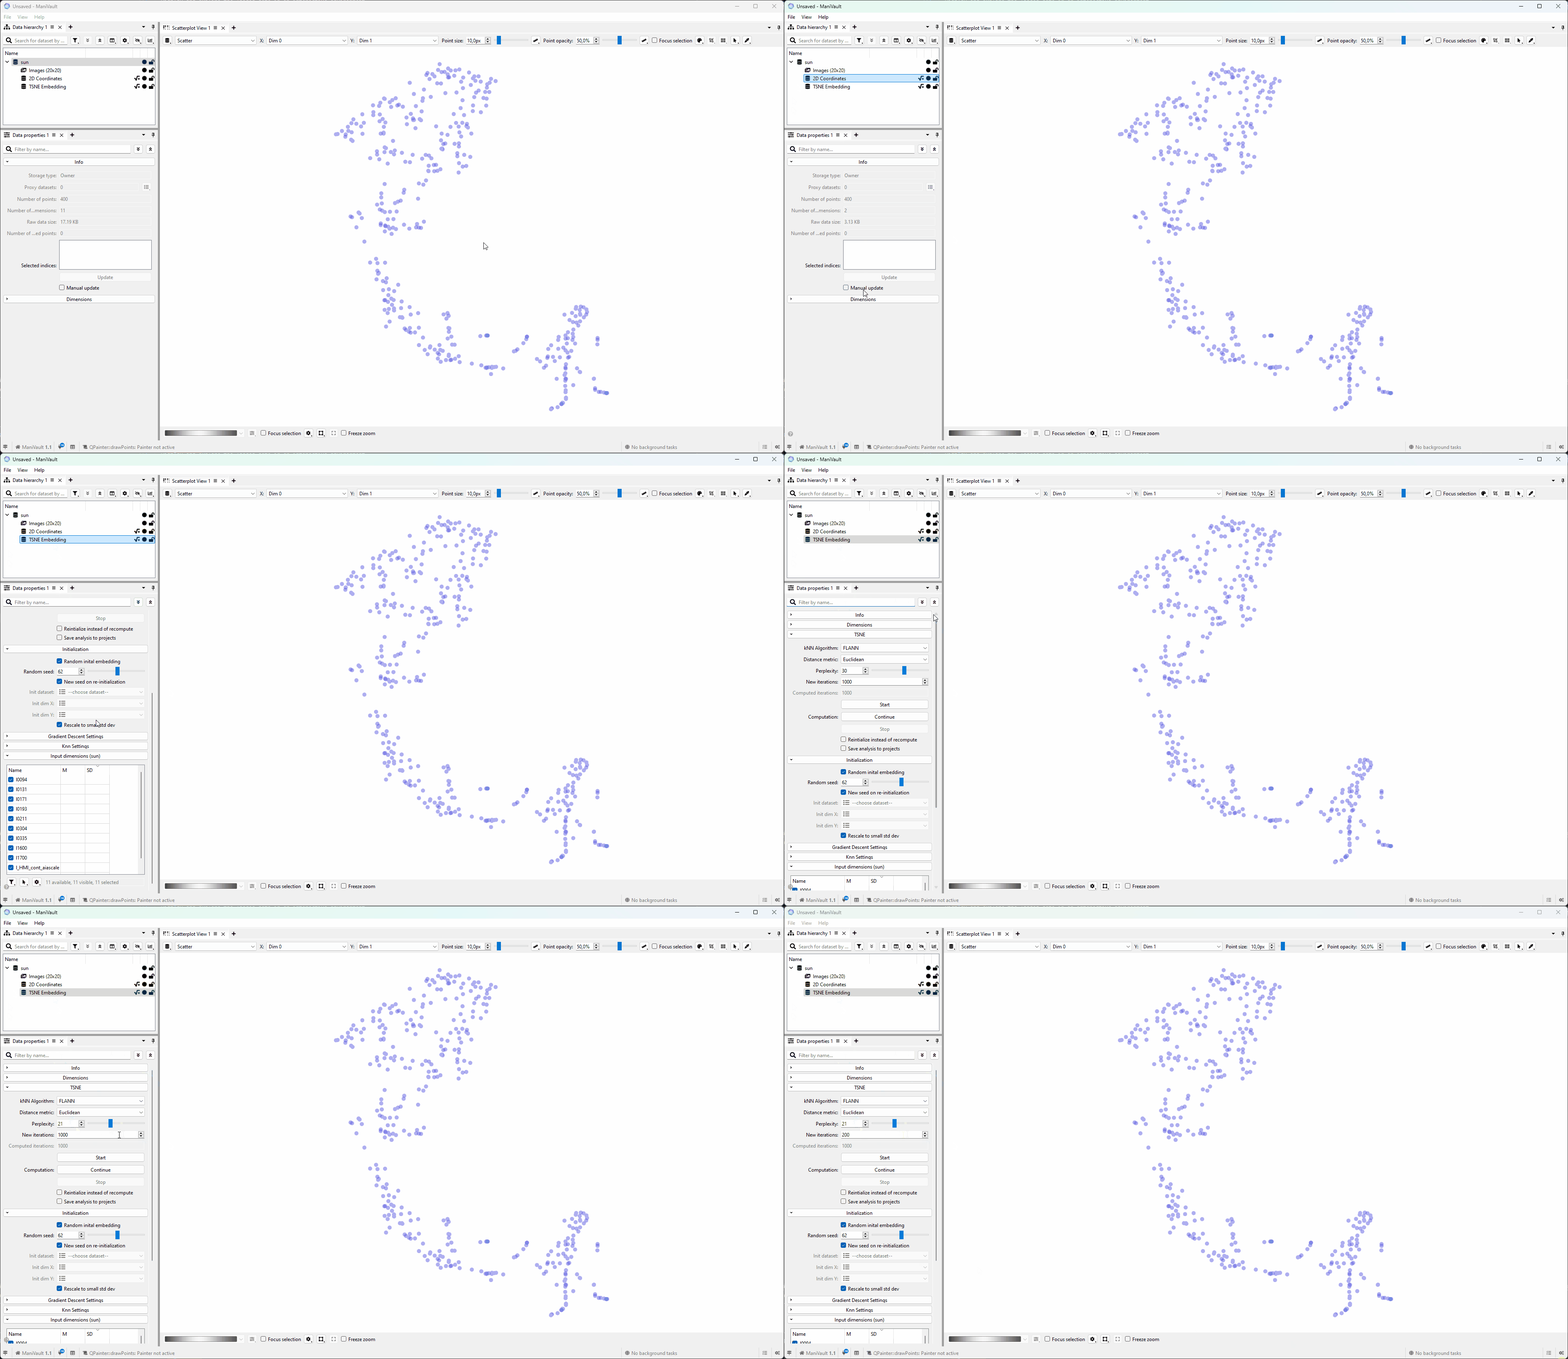
To view data properties and adjust analysis parameters there is a built-in system view plugin. Below is an example. For more details, please follow the Data properties plugin tutorial:
Click to view the video
Transform data
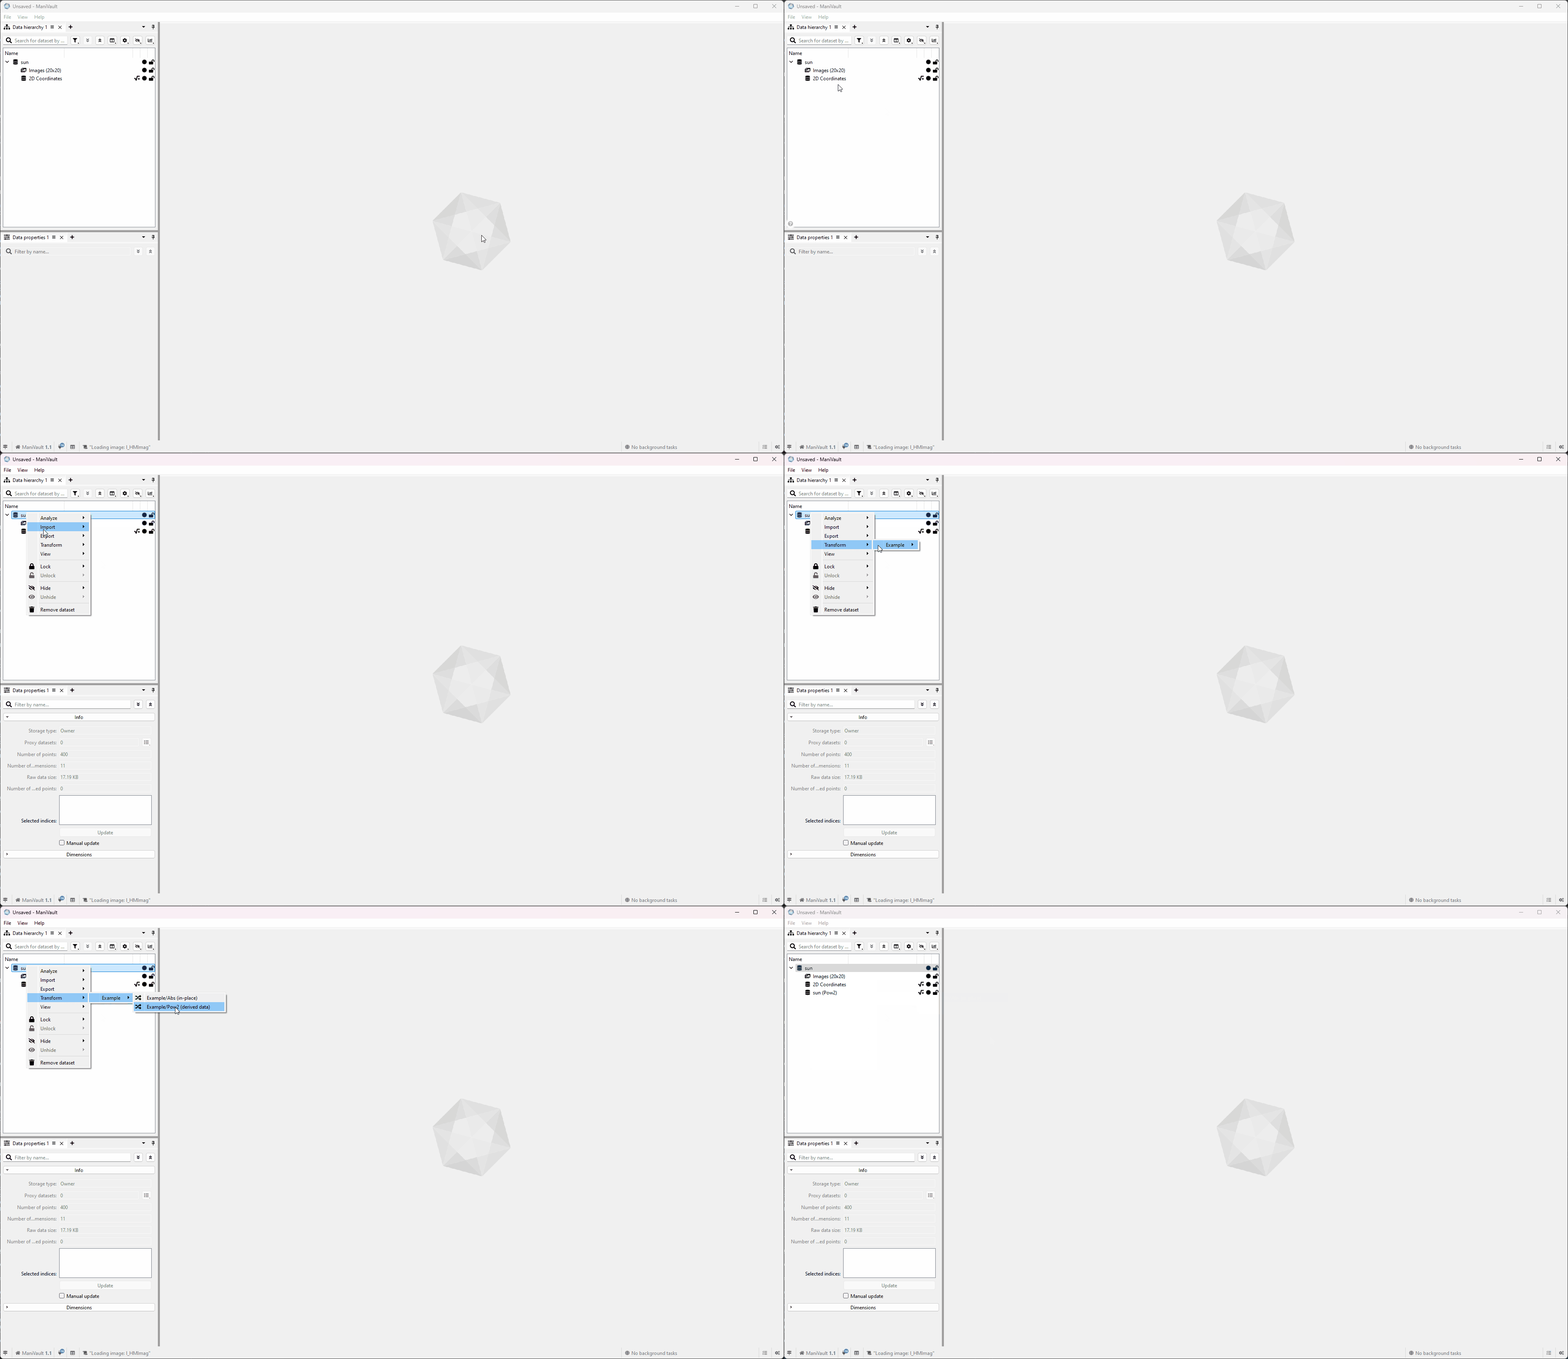
To transform data using the data hierarchy plugin:
- Select one (or more) datasets (hold CTRL to add a dataset and SHIFT to select a range of datasets)
- Right-click to show the context menu
- Click on Transform, this will show all compatible analysis plugins (this menu is not available when there are no compatible transform plugins)
- Click the transform plugin of choice
Click to view the video
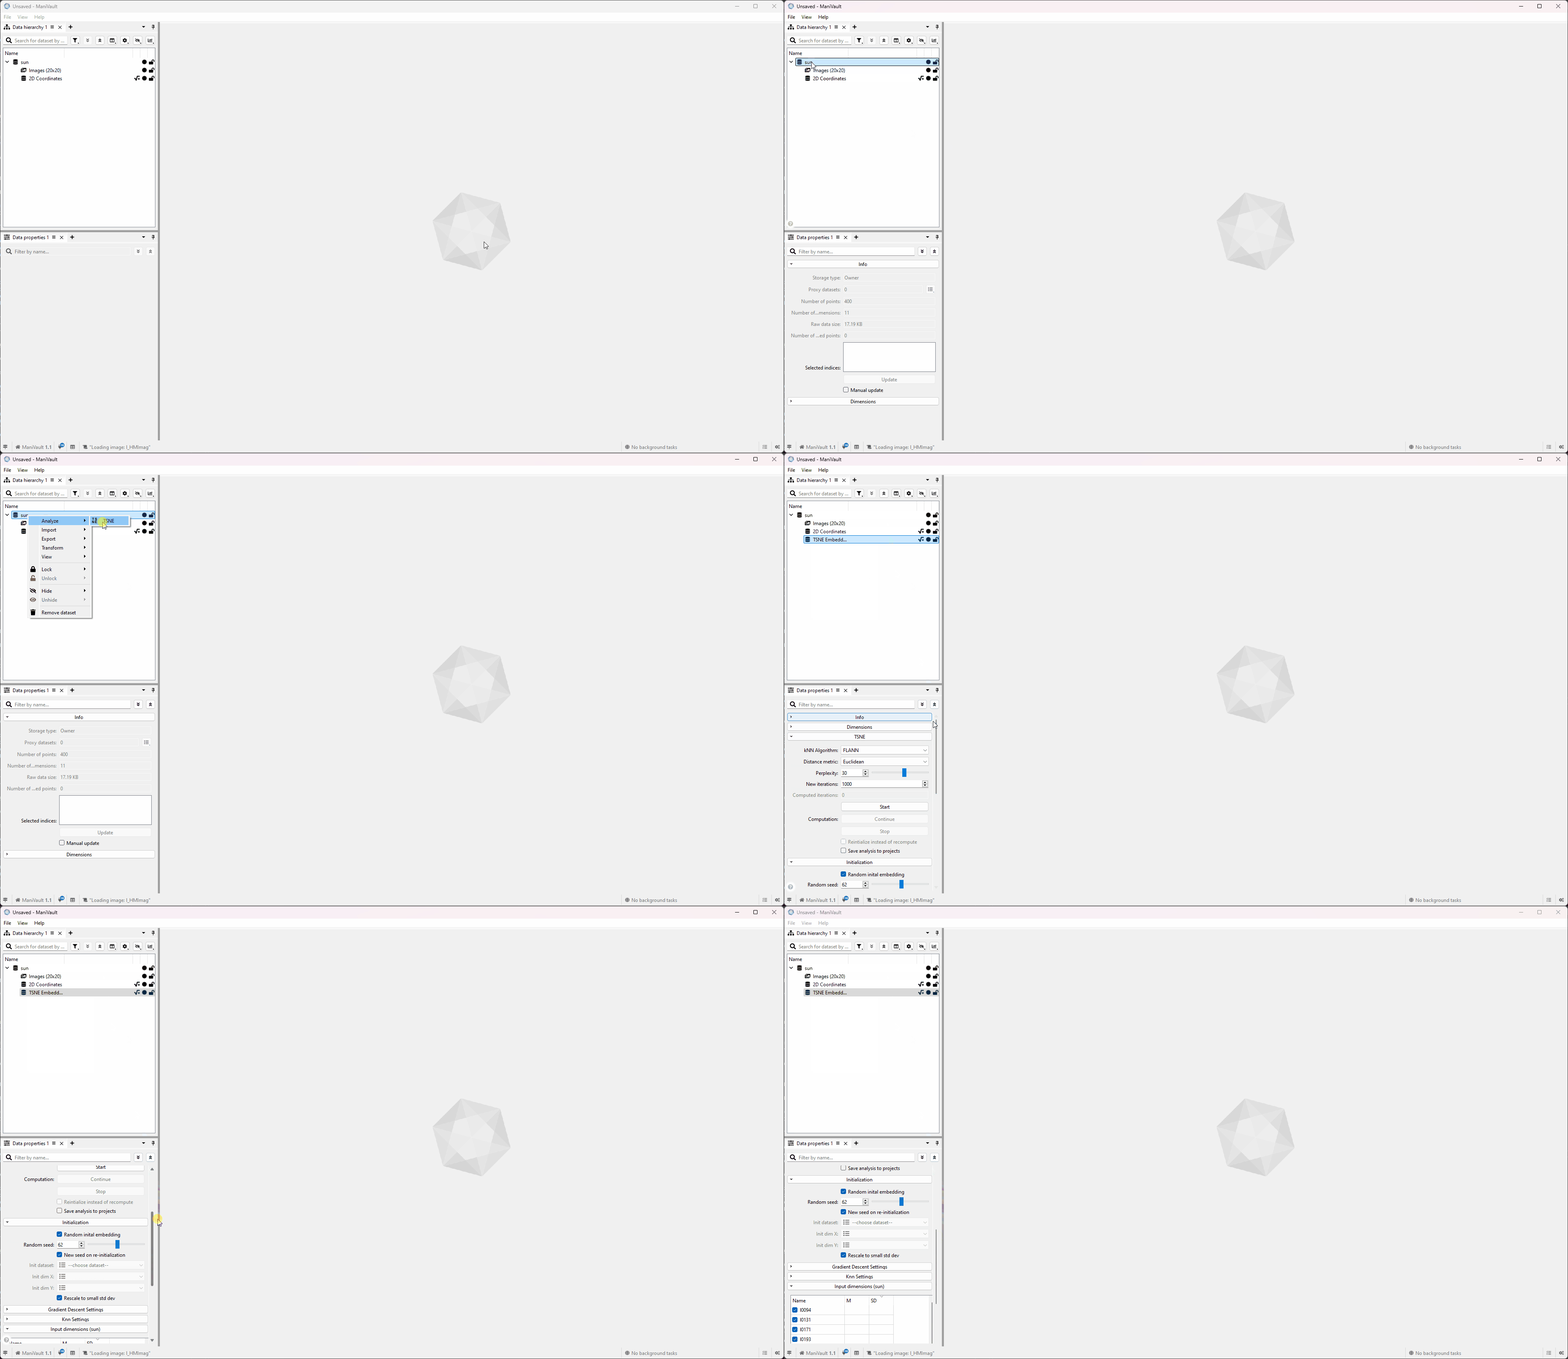
Analyze data
To analyze ManiVault data using the data hierarchy plugin:
- Select one (or more) datasets (hold CTRL to add a dataset and SHIFT to select a range of datasets)
- Right-click to show the context menu
- Click on Analyze, this will show all compatible analysis plugins (this menu is not available when there are no compatible analysis plugins)
- Click on the analysis of choice
Click to view the video
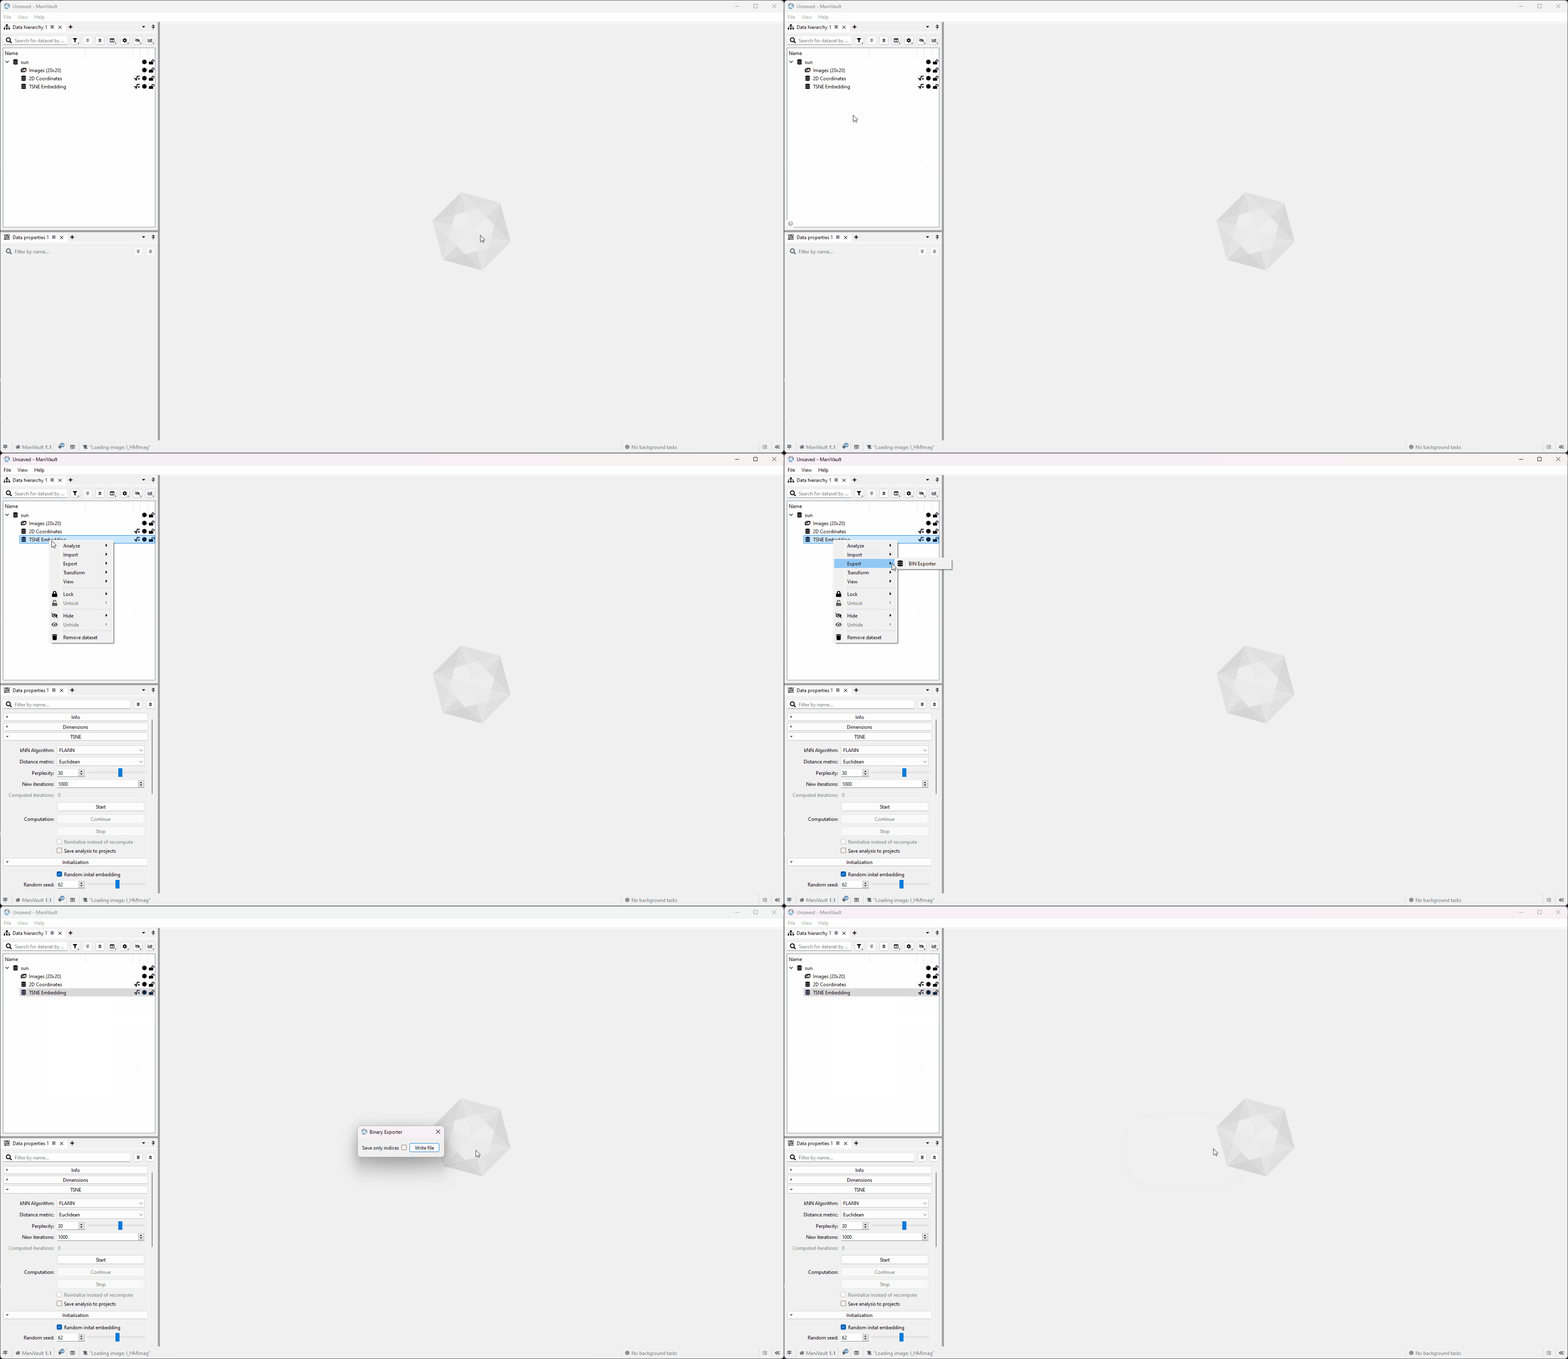
Export data
To export data from the data hierarchy plugin:
- Select one (or more) datasets (hold CTRL to add a dataset and SHIFT to select a range of datasets)
- Right-click to show the context menu
- Click on Export, this will show all data export plugins (this menu is not available when there are no compatible exporter plugins)
- Click the exporter of choice
Click to view the video
